
.png)
.png)
 Editor's Note: This post originally appeared on the HubSpot Sales Blog
In 1997, Billy Beane became the General Manager of the Oakland A’s. The A’s had the lowest payroll in Major League Baseball and in the four full seasons before Beane became GM, the A’s averaged less than 70 wins a season. Beane knew if he was going to build a contending team, he would not be able to do it the traditional way.Beane’s strategy -- as depicted in the 2011 film, “Moneyball” -- has traversed beyond the world of baseball to nearly all sectors of business and has become synonymous with making data-driven decisions.The tenet Beane and the A’s followed enabling them to average more than 93 wins per year for the following eight years had two components:
-
Discard highly valued “vanity” metrics that did not have a significant impact on winning baseball games.
-
Identify different metrics -- preferably those no one else was paying attention to but which had a significant impact on winning baseball games.
If Billy Beane were to take over a sales organization today, he would feel like he’d traveled back by about 20 years. Sales organizations today are dominated by metrics, but they’re rarely data-driven and even take actions counterproductive to the outcomes they desire. This results in higher costs, burnt out reps, high turnover, and frustrated customers. When noted economist Steven Levitt published the book “Freakonomics: A Rogue Economist Explores the Hidden Side of Everything,” he shared the disproportionate impact structural incentives have on the behavior of individuals and their output.Structural incentives are those created by the structure of what’s being done. They are often referred to as the law of unexpected consequences and are generally more powerful than explicitly stated incentives. Structural incentives are also one of the primary causes of difficulty in change management. In sales, the most common structural incentives are the metrics used to assess performance -- whether tied to compensation or not.The following five metrics are among the most common and destructive to building a high-performance sales organization.
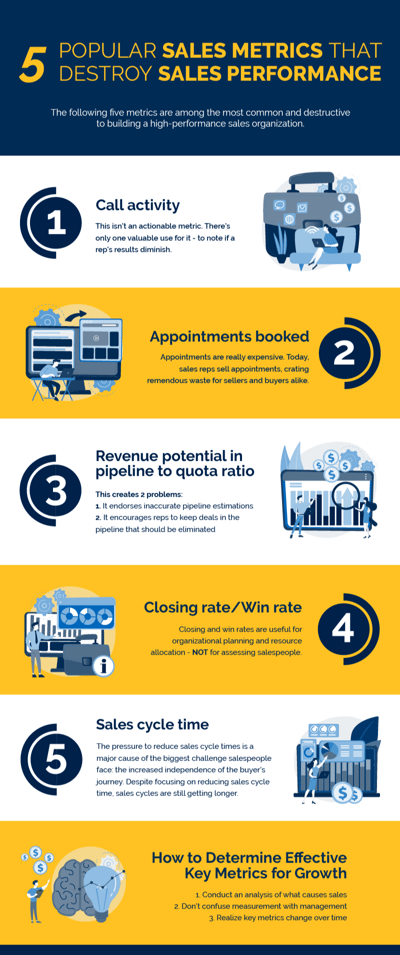 1. Call activity
The activity metric has been a bad metric from the beginning. Born from the belief “sales is a numbers game,” the idea behind tracking this metric is that “more activity is better.”
The only statistical relevance call activity has on sales success is there’s an activity level that’s too low and one that’s too high. The difference between too little and too much is often quite wide -- so, this isn’t a particularly actionable metric.
There’s only one valuable use for call activity. Over time, reps demonstrate a pattern of activity levels that tend to correlate to their success. So, it can be a useful, personal coaching data point to note if a rep’s results diminish.
2. Appointments booked
For years, I said call activity was the worst metric used in sales. It’s been overtaken by appointments booked. This metric was initially designed to address the problem of measuring just activity -- then, structural incentives kicked in.
Made worse by the massive growth of the sales development function, the world became dominated by "Can I have 15 minutes of your time?"
Here's the problem with appointments: they are really expensive. There's the direct cost, the opportunity cost, the downstream cost, and the bottleneck.
Today, sales reps sell appointments creating tremendous waste for sellers and buyers alike.
3. Revenue potential in pipeline to quota ratio
Most sales organizations operate on a 3x out 4x model, meaning the total potential value of all of the opportunities in the sales pipeline should be three to four times quota.
This creates two problems:
-
It endorses inaccurate pipeline estimations
-
It encourages reps to keep deals in the pipeline that should be eliminated
It also creates the structural incentives that favor reps sticking with low-quality opportunities, instead of weeding them out in order to free capacity for higher-value opportunities.
4. Closing rate/win rate
Closing and win rates are useful for organizational planning and resource allocation. They are not particularly effective for assessing salespeople.
When closing/win rates are used as key performance metrics, they incentivize two destructive behaviors:
-
Reps often filter out reject leads that aren’t ready to buy -- even if they have greater potential.
-
Once a deal is added to the pipeline, the metric creates an incentive to keep working the deal because that means they don't have to record it as closed/lost.
5. Sales cycle time
This metric is cited often as a key metric for the effectiveness of the overall sales process. Sales blogs and research announcements regularly proclaim sales organizations are becoming less effective because sales cycle times are getting longer.
Unfortunately, the pressure to reduce sales cycle times is a major cause of the biggest challenge they face: the increased independence of the buyer’s journey.
The easiest way to shorten the sales cycle is to start it as closely as possible to a purchase. For several decades, observers have discussed the need for sellers to stop pushing so hard for the sale and align with the buyer.
Little progress has been made here and the focus on sales cycle time is a major reason why. What’s sad is that despite this focus, sales cycles are still getting longer.
How to Determine Effective Key Metrics for GrowthSo, what would “Moneyball” look like if we were to apply it to the sales process? What are the right metrics to track?
Unfortunately, there’s no one answer to that question. There’s a paradox surrounding key metrics that boils down to this: the easier it is to identify and/or track a metric, the less valuable that metric typically is.
This means you must be purposeful in determining the metrics you track and designing the dashboards you use to monitor them.
To do so effectively, follow these three rules:
1. Conduct an analysis of what causes sales
There’s a famous saying in business circles that goes, “What you measure gets done.” For the most part, this statement is true. What’s missing is an additional clause warning, “So, be careful what you measure.”
I’ll spare you the lesson on statistics, but the key to creating metrics that lead to predictable results is to make sure what you track is a cause of the outcome you desire and that it doesn’t merely correlate or coincide with it.
While this lesson is certainly not new, very few organizations actually stop to figure out or even think about what causes sales for them.
If you’re new to this type of analysis, start with a simple one-step process. Answer the question, “What is the number one item that increases the probability a sale occurs?”
For example, I ran this analysis several years ago and we discovered a company fitting our ideal client profile that involved us in an assessment of their growth strategy was our primary causal driver.
As you become more advanced, you’ll be able to build up what I call a “causal chain” that’s typically three to five steps. Here are ours:
-
A meaningful conversation with a primary or secondary persona
-
A high probability indicator (HPI) aligning with our value proposition
-
Sponsorship from an authoritative primary persona
-
Completion of our assessment process
-
The cost of the problem is a multiple of the investment (varies by offering)
2. Don’t confuse measurement with management
I’ve studied thousands of sales and marketing organizations, and I’m convinced the reason many bad metrics exist is because managers regularly try to use metrics to replace the role of process and management.
It would be easy for us to give our reps a target/quota for each part of the chain, reward them for hitting targets, and manage by the numbers. It would be easy -- but not very effective.
This strategy might work for a short period of time, but reps would likely forget the “why” behind the metrics.
To build an effective, data-driven approach to sales, build your key metrics on those components the rep has the ability to strongly influence and manage the ones that don’t.
To finish this example, our reps have quotas on the number of meaningful conversations, sponsorship, and assessments they conduct.
Reps don’t control what problems exist or the costs of those problems. But they can execute a process allowing answers to those questions to be uncovered.
3. Realize key metrics change over time
A business is a living organism. As the business changes, so does the market it’s focused on. This means what you measured yesterday might not be what matters today.
If you’re in high-growth mode, update this analysis every three to six months. If you’re in a more mature growth phase, update it at least annually.