<img src="https://ws.zoominfo.com/pixel/Nfk5wflCTIIE2iSoYxah" width="1" height="1" style="display: none;">

Sales Velocity

The Metric That Can Transform Your Customer & Revenue Acquisition

metrics-problem
sales-velocity-2
sales-velocity-metric
calculating-sales-velocity

The Most Important Metric In Predicting Customer Acquisition Success

There is a term in poker called resulting. It refers to the action when a poker player creates too tight a relationship between the quality of the outcome of decisions or actions that are taken vs. the quality of the decision, at the time the decision is made. In essence, resulting is the act of judging every decision by looking in a rearview mirror.

Author, consultant, and winner of the 2004 World Series of Poker Tournament of Champions, Annie Duke shared a great example of resulting at work in a non-poker context in her book Thinking in Bets. She shared the story of the fateful decision made by Pete Carroll, head coach of the Seattle Seahawks, on February 1, 2015, in Super Bowl 49. The Seahawks were trailing the New England Patriots 28-24 with 24 seconds left in the game. The Seahawks had the ball on the Patriots one-yard line on second down, with one of the league’s top rushers, Marshawn Lynch, in the backfield. 

Carroll called a pass, and the rest is history. Patriots cornerback Malcolm Butler intercepted the pass, and the Patriots won the Super Bowl, preventing the Seahawks from repeating as champions. Carroll has been lambasted for the decision, often referred to as the worst decision ever made in the history of sports. Yet, the reality is the decision was quite good given the context of the situation and the probability of outcomes. (Don’t argue, it was a good decision and if you still believe it’s bad, read Duke’s book to understand why it's not.) 

Poker and football aren’t the only places where resulting rears its ugly head. It happens in baseball when you judge your at-bat by whether you get a hit or not - get a hit, it was a good at-bat, otherwise, it’s not. It happens in a big way in sales - make the sale and you had a good sales process, don't make the sale and it wasn’t. Yet we know that reaction is not true.

Resulting is dangerous because when you judge the quality of your decision by the quality of the outcome, you often learn the wrong things and reinforce the wrong actions. That’s why when describing a poker player as someone who was resulting, it’s likely describing why they lost a lot of money.

The Problem With The Dominant Sales Metrics

As the old adage says, “what gets measured gets done.” The fastest and easiest way to determine how people will behave is to identify what gets measured and celebrated. 

It doesn't matter what managers/leaders say, what they do, or even how they compensate. Salespeople coach and motivate themselves to “win” based on the metrics (score) that get the most attention. If you doubt the importance of the score, just go watch a group of 12-year-olds play a game, any game, before and after someone says, “Hey everyone, want to keep score?”

In the sales world, there are three dominant metrics that create a series of unintended incentives that guide the behavior of salespeople (like an invisible hand) and lead to resulting - by salespeople, managers and executives alike. 

Most sales organizations use one or more of these metrics:

  • Sales Cycle Time
  • Closing Rate
  • Closed Sales

What’s wrong with sales cycle time as a key metric?

There are three fundamental problems with sales cycle time, which has increasingly become the one metric that gets most of the attention. 

First, sales cycle time is measured by chronological time. Yet, chronology (the time on the calendar) is rarely the key constraint/bottleneck facing growth organizations. Don’t get me wrong, I understand that the sooner you close the business, the sooner (theoretically at least) you get paid - and getting paid sooner is good. So it’s certainly a metric that should be monitored, but when it’s elevated it leads to resulting (more on that below).

The second problem with the metric is it creates the illusion (often unintentionally) that the sales organization can meaningfully impact the timing in which a buyer buys. Certainly sales (and marketing) organizations can influence timing by degrees - and they can certainly impact how a buyer buys and who they buy from - but when you look behind the numbers you realize that for all the noise around discounting and sellers pushing buyers to buy sooner that a) it tends to only capture business that were already going to move forward so timing was only mildly impacted and b) it costs as much in lost opportunities (by angering, confusing, frustrating, etc. buyers) as it gains. 

What’s wrong with closing rates and closed sales as a key metric?

The third problem relates to all three of these metrics. They all heavily incentivize and (and often inadvertently) place the focus at the very end of the sales process, coming. This comes at the cost of attention and action geared to the earlier phases, where research highlights prospects and customers are more open to influence. I've also seen how small actions taken earlier in the process snowball into much bigger impacts than anything done at the end.

Consider the following questions/scenarios to highlight the absurdity of the incentives caused by these metrics:

  • What’s the easiest way to shorten sales cycle time? Don’t talk to a potential buyer until they’re ready to make the decision. As a matter of fact, every day you engage a prospect before they make their decision is a day you’re “adding” to the sales cycle.
  • Managers tell sales reps all of the time “you miss 100% of the shots you don’t take,” and “don’t fear rejection.” Then we report on (and often post/share) closing rates and praise those at the top. One of the reasons salespeople (seemingly) hate the leads created by marketing is that even when they are sales-qualified they are rarely order ready. A good SQL (sales qualified lead) still requires real work to be done by the sales rep and when there’s work to be done there’s risk. Better to reject the lead, complain about marketing and keep my closing rate intact.
  • One of the common problems I see with reps (and with bad poker players) is that they spend too much time on lower-quality opportunities and not enough time on higher-quality opportunities (which also reduces the time and ability to create new higher quality opportunities). Why is this so? Because “Closed/Lost” is to be avoided. As long as it’s not “lost” the closing rate (and the pipeline value) have not been negatively impacted (and in a perverse sense sales cycle time isn't impacted because the number is typically calculated only on close opportunities). On a side note, when we begin working with sales organizations, one of the first things we do is a deep dive into the existing pipeline. It’s not at all unusual to find that 50-90% of the opportunities are no longer (or never were) valid.
  • Jill Smith at ABCCo (one of my top 5 target accounts) shares with me that she’s interested - really interested, but they’re finishing a rollout of their new ERP system, and then it’s conference and strategic planning season. She simply can’t take any real action on this for 9 months, but she definitely wants to keep a dialogue going. What do I do? If I accept the lead and put her in the pipeline, it’s going to hurt my sales cycle metric and I keep hearing management talking about the importance of reducing our sales cycle.

While some of the scenarios may seem a bit exaggerated, consider all the studies that show buyers are conducting more and more of the purchasing process on their own before reaching out to sales organizations. If that’s true, is it true because buyers genuinely want it that way, or because we’ve created the hidden incentives that have led buyers to believe it’s the only way they can do it?

We Need Better Customer Acquisition Metrics

This problem is not unique to sales or marketing. Luckily for us, other disciplines have dug deeply into this problem and creating maps that we can follow. 

Poker is a great metaphor for customer acquisition as it is a competitive pursuit, the situation changes multiple times and you never have access to all relevant information. The same is true for baseball.

That’s why poker players use odds and probabilities to assess the quality of their efforts and decisions. Baseball used to be a lot like sales, obsessed with analytics that not only didn’t contribute to their desired outcomes but often worked against them. Hence they created “advanced analytics” (what real data-nerds know as sabermetrics). Today, there is not a top-level professional franchise in any sport that would even consider moving forward without such analytics. (Hell, they’re even using such analytics for professional video game playing, uhm, I mean esports.)

The time has come for sales metrics to move into the modern age. It’s time for some advanced analytics. And, what WAR (wins over replacement) is to baseball, Selling Velocity is to sales.

Before I explain what selling velocity is and how to calculate it, let’s identify the critical components that would make such a metric valuable and predictive.

  • It must meet the basic criteria associated with a balanced scorecard. While it must avoid overweighting the over-rated activities that occur towards the end, it must not overvalue the early activities that, while they have a much greater influence on future activities, are also still largely speculative in nature.
  • It must integrate the hard and soft contributors to a sale. As such, the analytic must have a predictive nature. For the metric to be valuable it must reinforce, for the salesperson and manager, those elements that cause sales.
  • It must align with a probabilistic rather than a deterministic approach. One of the primary problems with the vast majority of go-to-market and attribution metrics is that they sacrifice insights & value for creating a greater sense of (false) certainty. To make selling more predictive, we need to stop thinking about it as “right or wrong/win or lose.” Instead, we must look at it like other disciplines. Are the actions we’re taking increasing the probability of attaining the desired outcomes? The dynamic nature of sales (like life) will always create a meaningful level of uncertainty, and we must embrace that rather than ignore it. Here again, baseball is a great metaphor. All of the analytics that are used to assess progress and prescribe improvements are of very little value on any single at-bat, game or even series of games. Utilizing analytics increases the likelihood/probability of success over reasonable periods of time. In baseball, poker and sales you can do it right and lose (just like you can do it wrong and win). 
  • It must be simple in its application, but embrace the complexity and variance in the paths a sales organization or sales rep can take to be successful. Here again, the weakness of most metrics is they are used because they’re easy to measure, not because they’re valuable.
  • It must be flexible enough to align with the unique situations and context of different sales organizations and companies. Unlike poker, baseball or other examples I’ve referenced here, every sales organization should be playing a (at least a slightly) different game - their game - that should embrace their strengths and advantages.

Introducing The Sales/Selling Velocity Metric

Selling (or Sales) Velocity is designed to meet all of these criteria. Full disclosure: we are still in the testing phase of this metric. We’ve used it internally with very promising results and we’ve implemented aspects of it with our clients, again with strong results. The specifics around this metric are likely to evolve and we will be updating this page with the advances and learnings we gain.

The are two distinct Sales Velocity Calculations:

  • Prospecting, market development & sales development (whatever you call it) - focused on the sales opportunity creation phase of the sales process. The calculation works well for both those dedicated to prospecting (like sales/business develop rep teams) or for full-cycle sales reps to keep quality score of their prospecting efforts.
  • The full acquisition and/or expansion sales process. This calculation is a bit more complex and requires some strategic decisions to account for the various situations that each selling organization finds itself in.

The Signal That Selling Velocity Is Looking to Highlight

At Lift, we’ve had the opportunity to study thousands of sales interactions as well as review a number of studies looking to identify the key inflection points between great sellers and mediocre ones. In creating this metric, we had two objectives:

  • We wanted to create a metric that would truly create greater predictability of success (ideally earlier than we typically get such an indication), and thus could be used prescriptively to guide actions, skill development, management, and coaching.
  • We wanted to create a single metric that would enable meaningful comparisons and insights highlighting the progress that a sales rep is making (are they truly getting better at impacting those things that cause sales?). We want to replicate what WAR has done for analyzing performance in baseball.

This research led us to identify 5 factors that demonstrate a strong contribution to sales success:

  • Engage and influence prospects early in the sales process (often before there’s even a formal buying process in place)
  • Teach and influence decision criteria, while expanding engagement across the prospect’s organization
  • Align with the selling organization’s go-to-market strategy
  • Maintain a disciplined, dynamic pipeline with consistent movement and progress with active opportunities
  • Effectively utilize the time for selling. 

It is the last signal that we were most looking to spotlight. Optimizing any complex system requires maniacal focus around managing and reducing the impact of constraints and bottlenecks (even if it appears to make the "system" less efficient). Our biggest complaint about how most sales organizations view sales cycle time is that the focus on chronological time does not address a selling organization’s primary constraint - sales rep time. Sales Velocity aims to solve this, by clearly highlighting how effectively salespeople utilize the sales time they have.

What’s Required To Calculate Sales Velocity

To calculate Sales Velocity you will have to do some work in advance.

Tightly Defined Lead Management & Sales Pipeline

For Sales Velocity to be a meaningful metric, you must have a clearly defined sales process that includes:

  • Specific stages aligned with your sales process. (If you have a dedicated business/sales development function, we highly encourage that you create a staged process for that as well.)
  • Exit criteria for each stage. 

Having exit criteria is a requirement. I have empathy for the sales executives that are responsible for the metrics that dominate today’s sales organizations. Their sales processes were so vague and ambiguous that the real answer to the question “What stage of the pipeline is opportunity “x” in?” was “What stage would you like it to be in?” 

To create a balanced score, there must be an objective “version of the truth” that is followed by all people involved. Here are examples of a lead management (pre-SQL) pipeline and a sales pipeline with exit criteria (note: these are the criteria we use for our sales process at Lift):

pipeline-exit-criteria

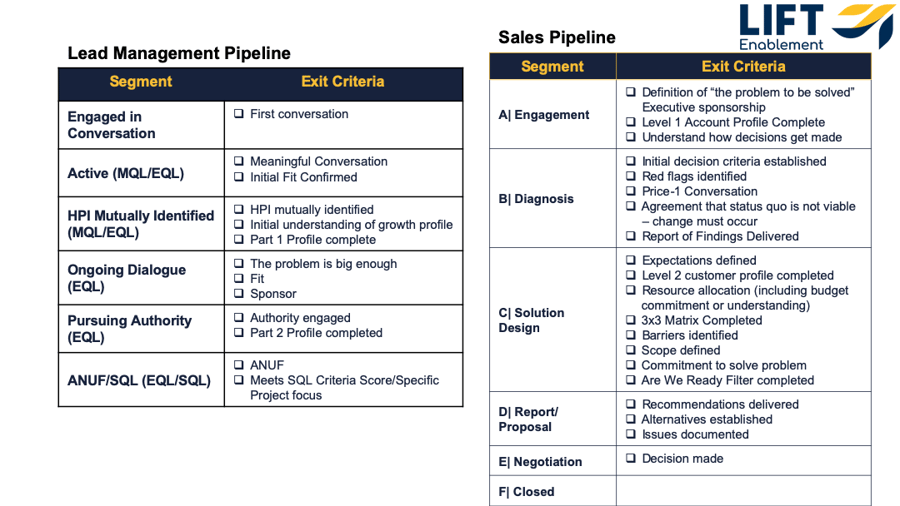
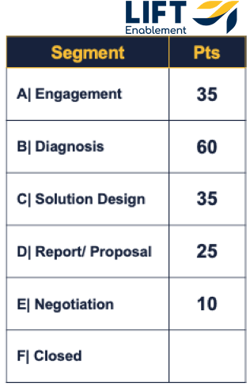
With the stages of your sales clearly laid out, the next step is to assign point values for completing each stage - we call this velocity points. Here is our sales pipeline with the points earned for completing each stage.

velocity-points

Identify the activities that are important and lead to better sales outcomes

Sales Velocity is the most powerful metric in sales because it has a significant impact beyond just the analytics that it provides. Setting the stage for tracking Sales Velocity requires that you create alignment behind what is important.

We highly recommend that you complete a What Causes Sales Analysis as part of the process to optimize your sales results. If you’ve completed that analysis, this step should be pretty easy. If you haven’t, do the best you can, but don’t get stuck here. Remember you can always make adjustments.

You’ll want to identify the various activities that lead to better outcomes. Here are some examples of activities that we’ve identified and used in various situations:

  • Lead Management/Pre-SQL Activities
    • Connects 
    • Meaningful Conversations
    • AWAF/Initial Discovery Meeting Scheduled (also meetings held)
    • Challenges identified
    • Getting to stage 3 of lead management pipeline
    • Specific videos watched
    • Register/attend a webinar
  • Sales Process
    • Profiles/Questionnaires completed
    • Specific profile information learned
    • Information gained from a specific persona
    • Key message points/presentation delivered (and to multiple key personas)
    • Key persona engagement with blog posts

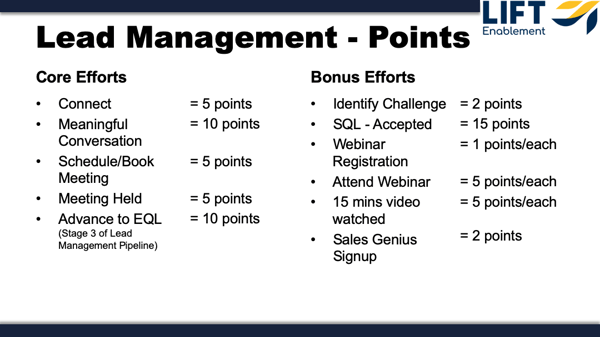
After you’ve listed your activities, the next step is to establish point values for each activity.

This step, done right, is extraordinarily powerful. It enforces alignment. We’ve learned that it’s very easy for multiple people within an organization to “agree” that two activities are “important,” only to see intense arguments when the level of importance gets a point value associated with it. If you say activity “a” is worth 15 points and activity “b” is worth 5, you’ve also communicated that “a” is worth 3x “b”. 

What’s important to note here is that your job here is to create a focus on the points that are scored, not on how the points are scored. This is where the creative ability of your sales team is unlocked. For example, as you’ll see below, we have a few key messages/presentations that we’ve learned are very valuable in increasing the likelihood of a positive sales outcome. We’ve given each one of those items a value of 5 points per key persona that has it presented to them. The sales rep is freed to determine the best way to deliver that presentation - live or video. If the rep gets 3 personas to watch a video, she gets 15 points. If she presents it herself, she gets 15 points. This type of scoring path is what frees the rep to figure out how to best use their time, and in many cases to multiply their time.

When you begin building out your Sales Velocity metric, you’ll likely want to limit the number of activities that you include. As you gain momentum, you’ll find that adding more activities enhances the power of the process (so long as those activities are, in fact, important). The key is to keep a balance between making it too complex (where everything gets points) and providing the rep with the ability (agency) to design their own path to success.

Here are two examples of an activity points board for each type of process:
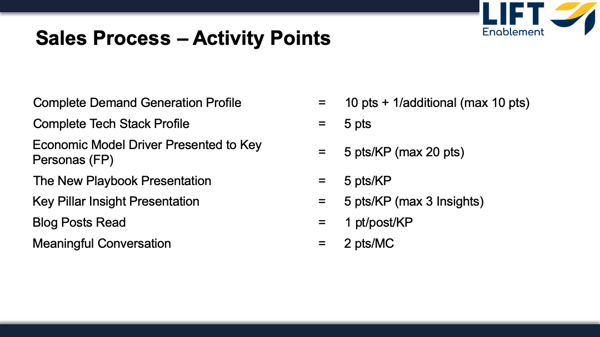
lead-management-points

sales-process-points

Key Economic Metric

Your key economic metric (KEM) is the end metric you use to judge sales. It could be any of the following (or more):

  • Revenue
  • MRR/ARR
  • Gross Profit
  • Customers
  • Users

You’ll use your KEM to weight the value of points generated for each account/opportunity.

Key Economic Metric Factor

What can I tell you? Sales is complicated. 

Here’s a sales riddle for you. You’re the VP Sales for a growing company. You’ve got two sales reps, with pipelines that look like this:

  • Pipeline 1 has 6 opportunities with a total value of $3MM
  • Pipeline 2 has 1 opportunity with a total value of $3MM

Which pipeline would you rate as better? Most would likely choose pipeline 1, and in most cases, we would agree. In this case, most people would agree that a $3MM opportunity is better than a $500,000 opportunity, but it’s not 5x better. However, if your business were focused on large opportunities, you may find pipeline 2 better and pipeline 1 inadequate (we’ve worked with companies that would question why a salesperson is pursuing any opportunity worth less than $1MM).

Here’s another example of where using only the KEM isn’t enough. We worked with a company several years ago that found their sweet spot was revenue opportunities between $200,000 and $500,000. While they did do some work with customers that generated much more than $500,000 they found that the competitive environment was much more difficult, the margins were lower, customer demands were higher and they were always more likely to leave to save a few points. In this case, the company preferred a $250,000 opportunity to a $750,000 opportunity. Candidly, that’s a hard thing for a sales rep to fully grasp. Without a defined structure, reps are naturally programmed with the belief bigger is better.

This is where the KEM factor comes in. This is the factor used to normalize these variables to ensure that the scoring mechanism aligns with the overall go-to-market strategy.

Calculating Sales Velocity

There are two parts to the Sales Velocity:

  • Selling Velocity Points - this calculates the pure point value for a period of time.
  • Selling Velocity - this calculates the rate of growth of points in one period of time compared to a previous period

To calculate Selling Velocity Points, we recommend you use two different scoring methods:

  • For the prospecting/marketing development portion, you just add up the points based upon the scoring rubric
  • For the sales process, use this formula

SVP

To calculate Velocity, use this formula:

SV

Questions?

Chat with us now
Schedule a call

More Insights & Resources

7-reasons-hiring-more-salespeople-cta
3 Playbooks for Sales Development
Unlock the Latent Power
sales-enterprise-review-cta-1